
Data & Projects
My methods work is developed hand-in-hand with the complex biomedical data types below. Code and data associated with each project are released alongside the corresponding preprint or publication; see the Publications page for full citations.
Spatial Transcriptomics
Spatially resolved gene expression profiles that preserve the tissue coordinates of each measurement, allowing transcriptomic activity to be studied jointly with tissue architecture. I use these data to model gene-gene and ligand-receptor interactions and to integrate transcriptomic regulatory signal with histomorphological features of the tumor microenvironment.
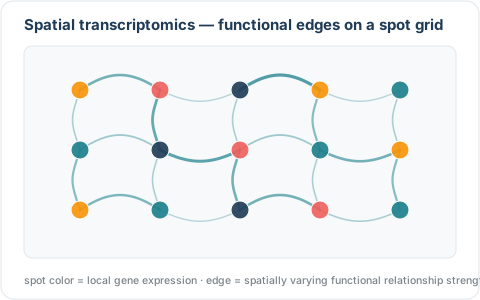
- Bhadury, S. et al. Graph-Based Multi-Modal Learning for Integrating Histopathological and Transcriptomic Features in Lung Cancer — graph-based fusion of transcriptomic and histopathological features in non-small cell lung cancer (LUAD-LUSC) to identify gene interactions and ligand-receptor interactions.
- Tsang, A., Krishnan, S., Kulkarni, R., Bhadury, S., Rao, A., et al. Encoding functional edges in graphs to model spatially varying relationships in the tumor microenvironment, npj Artificial Intelligence.
2D & 3D Multiplexed Immunofluorescence (mIF)
High-plex single-cell imaging that records the spatial coordinates and marker intensities of many cell types on a single tissue section (2D) or across serial sections and volumes (3D). These data let me build spatial graphical models of the cell-cell interaction networks that make up the tumor microenvironment, and to test whether those interaction patterns differ by disease state.
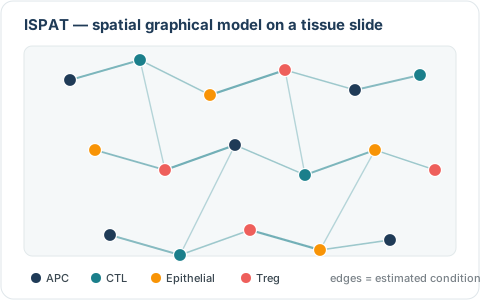
- Bhadury, S. et al. ISPAT: Informed Spatially Aware Patterns for Multiplexed Immunofluorescence data, Nature Scientific Reports — Bayesian spatial mixed-effects modeling (Poisson & Gaussian) of cell-type intensities across tissue slides. Code
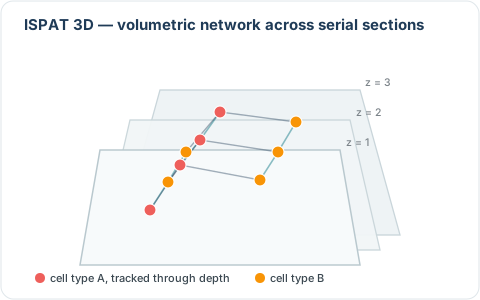
- Bhadury, S., Rao, A. ISPAT 3D: Spatially Varying Conditional Volumetric Network Estimation for 3D Tumor Imaging — extends spatial network estimation to volumetric, 3D multiplexed cancer imaging. Code
- Bhadury, S., Gaskins, J., Rao, A. Spatially Varying Graphical Models for Cell-Cell Interaction Networks in Multiplexed Tissue Imaging
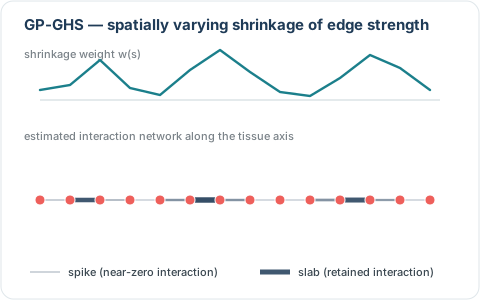
- GP-GHS: Gaussian Process Group Horseshoe for spatial Cell-Cell Interactions in Tissue Images — group horseshoe shrinkage priors combined with Gaussian Process spatial structure for interaction network estimation. Code
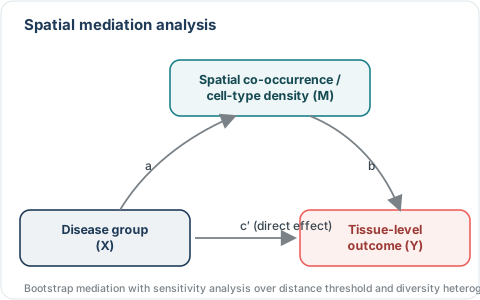
- Mediation and sensitivity analyses testing whether cell-type density and spatial co-occurrence patterns mediate the relationship between disease group and tissue-level outcomes. Code
Magnetic Resonance Imaging (MRI)
Volumetric radiologic imaging used to derive tumor shape and radiomic features for non-invasive characterization of tumor phenotype, which I combine with other modalities for multimodal survival modeling.
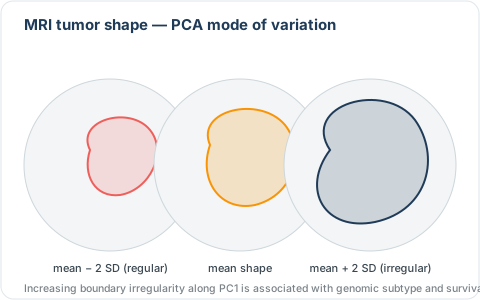
- Statistical shape analysis (PCA-based) of MRI-derived tumor contours in lower-grade glioma. Code
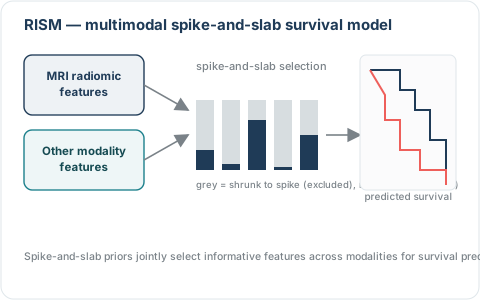
- Bhadury, S. et al. RISM: Radiomic feature Integration with Spike-and-slab for Multimodal survival analysis — spike-and-slab variable selection for integrating MRI-derived radiomic features with other modalities in survival models. Code
H&E Imaging
Hematoxylin and eosin stained whole-slide images capturing tissue and cellular morphology. I use these images to extract histomorphological features and integrate them with molecular and spatial data for a more complete picture of the tumor microenvironment.
- Bhadury, S. et al. Graph-Based Multi-Modal Learning for Integrating Histopathological and Transcriptomic Features in Lung Cancer — see the graph fusion figure above.
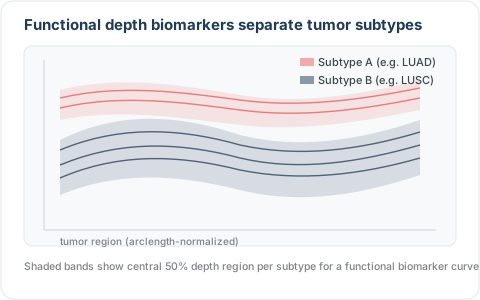
- Bhadury, S. et al. Functional Depth biomarkers Distinguish Lung Cancer Subtypes
Figures above are original schematic illustrations I created to summarize each project’s modeling approach; they are conceptual diagrams, not reproductions of figures from the papers.